While temperatures are rising in Hungary, the government blocks the EU’s 2050 carbon goals

’There is no reason to rush’ a high-ranking Hungarian government minister said when he was asked at a press conference why Hungary blocked the European Union’s 2050 zero carbon goal. The words were uttered by Gergely Gulyás, Minister of the Prime Minister’s Office, who explained why Hungary changed its previously stated decision and joined the Czech Republic and Poland in vetoing the EU climate goal. According to the government of Hungary, this climate goal would be ’too costly’ for Hungarian citizens and 2050 is too far anyway.
However, if we look at climate data from Hungary we can clearly see that this country should not turn a blind eye to climate change. If we look at climate data since 1901, we see that in the past century there were only four years where the average temperature was lower than in the first year of the 20th century. Moreover, the last such year was 1956.
Also, the average temperature in Hungary today is 3 degrees Celcius higher than it was in the first year of the last century. In the meantime, there were much fewer cold days.
If we take a closer look at the data from Budapest, we can see that nine out of the ten hottest time periods from since 1901 happened after 2007. If we look at the specific months, we can see that the spring and summer months are warmer than they used to be and that winter months are milder – there are fewer extreme cold months.
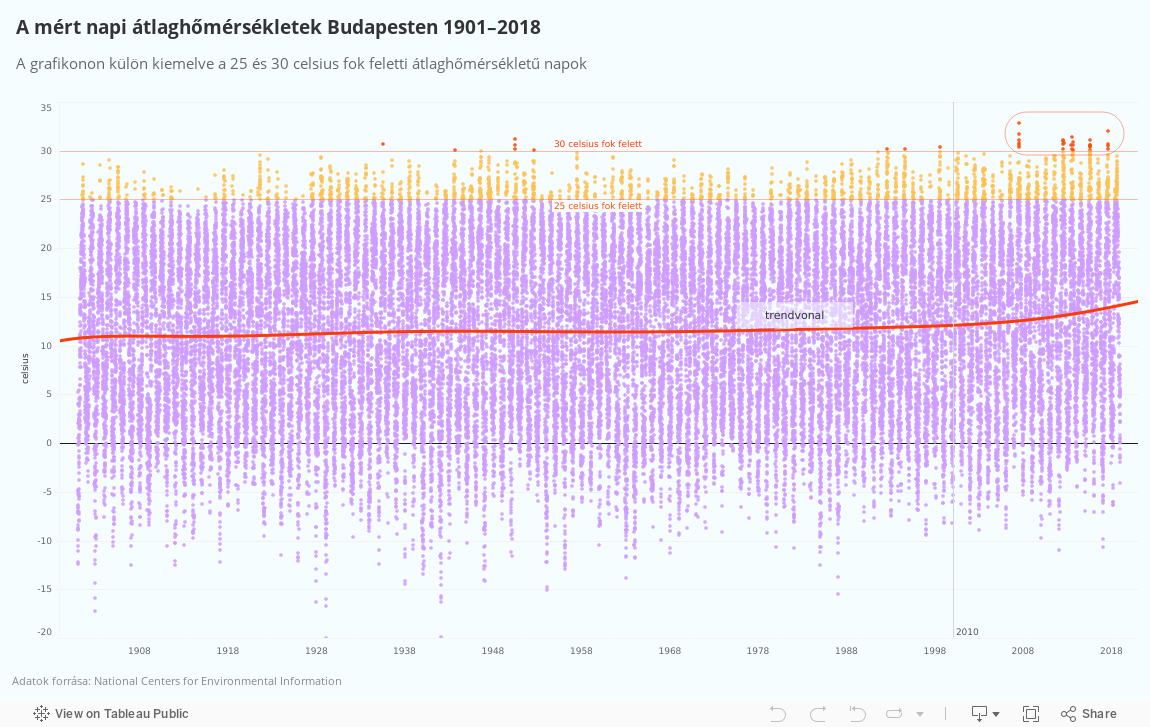
Also, there are more and more days in Budapest with temperatures rising above 25 and 30 degrees.
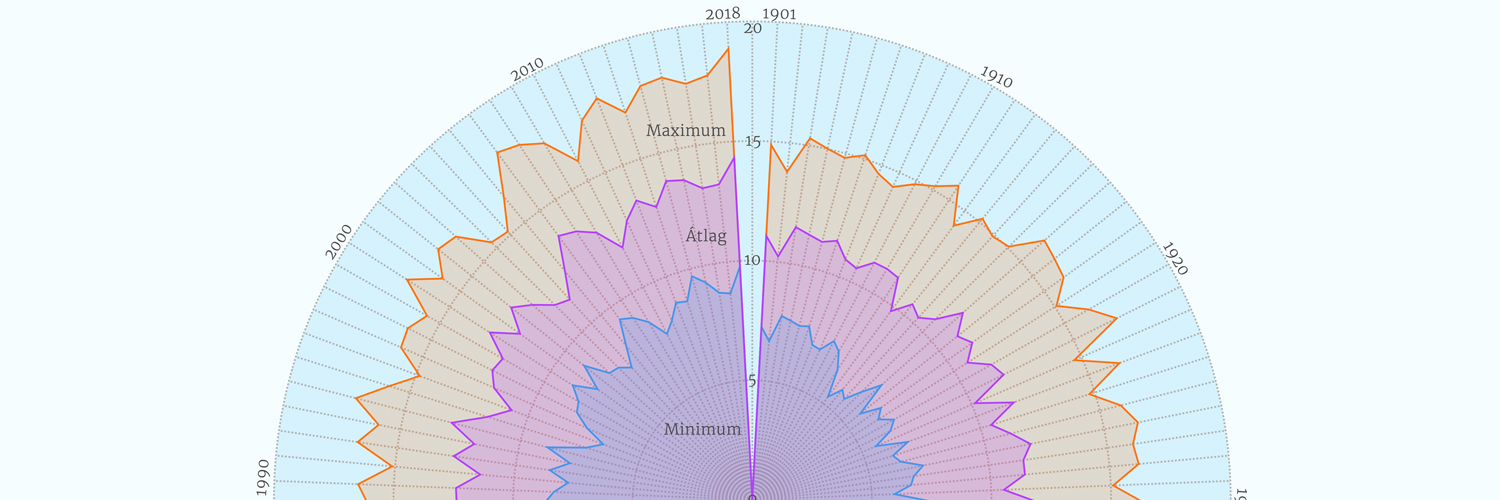
Annual average temperatures in Budapest since 1901
Purple: minimum average; Orange: maximum average; red: annual average
Difference between annual average temperatures in Budapest and 1901 as a base year
Purple: minimum average; Orange: maximum average; red: annual average
Change in the annual min average, max average and average temperatures in Budapest since 1901

Purple: minimum average; Orange: maximum average; red: annual average
Change in monthly average temperatures in Budapest since 1901
These charts show how the monthly average of daily average temperatures changed
Daily average temperatures in Budapest, 1901-2018
We highlighted the days with an average temperature above 25 and 30 degrees
Written and created by Attila Bátorfy
Source of the data: National Centers for Environmental Information
See the entire project on the site of our data team, Atlo, with more data from rural towns in Hungary. You can read the original, Hungarian version of this story here. English version by Anita Kőműves.

Share:
Your support matters. Your donation helps us to uncover the truth.
- PayPal
- Bank transfer
- Patreon
- Benevity
Support our work with a PayPal donation to the Átlátszónet Foundation! Thank you.
Support our work by bank transfer to the account of the Átlátszónet Foundation. Please add in the comments: “Donation”
Beneficiary: Átlátszónet Alapítvány, bank name and address: Raiffeisen Bank, H-1054 Budapest, Akadémia utca 6.
EUR: IBAN HU36 1201 1265 0142 5189 0040 0002
USD: IBAN HU36 1201 1265 0142 5189 0050 0009
HUF: IBAN HU78 1201 1265 0142 5189 0030 0005
SWIFT: UBRTHUHB
Be a follower on Patreon
Support us on Benevity!