2021 in figures – charts and data visualizations about the important events of last year


2021 was a tough year. Not only have we had to deal with the global coronavirus pandemic, but also with the economic and other impacts of disease management, while our country emerging from quarantine has also had its fair share of political excitement. We have compiled a selection of the year’s most important facts and figures.
Collapsing and recovering economies
By the second quarter of 2020, the economy had collapsed everywhere. The fall in GDP per capita was dramatic, and although the performance of economies rebounded sharply by the third quarter, it had not reached its pre-epidemic level by the beginning of this year. It is also true for the EU, where GDP per capita remained lower than the previous level, while the United States is performing modestly better than before 2020. The same can be said for Hungary, which has no cause for complaint, at least looking at its GDP figures.

Quarterly GDP per capita in OECD countries
The situation is different with inflation, which is a lot higher in Hungary than in countries in the EU or the US. It is clear that the most significant challenge in the coming period will be the issue of skyrocketing prices. Looking at the chart, Hungarian economic policy has so far failed to meet this challenge, despite the central bank’s continued interest rate raises.
Monthly percentage change of consumer price indices on the same period of the previous year
Successive waves of pandemic
Two epidemic waves have swept across the continent this year. Hungary was hit by the third and fourth waves of COVID-19 in late winter/early spring and late autumn. In terms of infection rates, the two waves were almost identical. In spring, the Hungarian figures were extremely high, while by autumn they were average, with the addition that the initial increase was low compared to the European average, followed by a sudden, steeper than average increase and then a steep drop in the number of cases, as in other countries.
Weekly new cases in European countries in 2021 (normalised to 1 million people)
The mortality curve was different. The high infection rate in Hungary in the spring was accompanied by a sadly high death rate. For much of the autumn, deaths were much lower in Hungary than in most countries on the continent, only starting to rise in late October, before peaking relatively soon afterwards and falling sharply again.
Weekly new deaths in European countries in 2021 (normalised to 1 million people)
Based on the aboved mentioned, and international data, we concluded in early November that the fourth wave will follow the second wave and is likely to be able to cope with the burden on the health care system.
Beyond Covid-19
While the most important topic was the pandemic in 2021, people were curious about other issues as well. Google Trends’ annual summary gives us an idea of what the most popular topics were this year and what terms Hungarians searched for most in 2021. Two sporting events have topped the list of the in recent months: the European Football Championship and the Tokyo Olympics, where Hungary won a total of 20 medals.
The above-mentioned fact that the epidemic has also had a major impact on our year is illustrated by the fact that four of the most searched terms were related to the coronavirus vaccine. Many people were trying to find more information about the Pfizer and AstraZeneca vaccines, and there were also a good number of people who wanted to know how to register for the vaccine or how the vaccination programme was going in the country. The top 10 overall list also included two Hungarian public figures: Andrea Várkonyi, who recently married Hungary’s richest man, friend of Prime Minister Viktor Orbán, Lőrinc Mészáros, and Péter Márki-Zay, who, after his victory in the primaries is running as the opposition coalition’s candidate for prime minister in the 2022 parliamentary elections.
Many were also interested in the unexpectedly popular South Korean series, Squid Game. On the film front, it is also worth mentioning the movie called ELk*rtuk, created by 800 million HUF, produced by Gábor Kálomista (well-known supporter of the current ruling party, Fidesz), which, according to Google, also captured the imagination of many internet users this year.
But in 2021, a lot has happened not only to the world and Hungary, but also to us, the data team of Atlatszo.
Besides CoronaMonitor, our page about the primary elections was the most visited
This year, data journalism section of Atlatszo, ATLO has also produced a number of projects, either alone or in collaboration with clients. The year started with the IJ4EU-funded project Hungarian Money, which, in addition to Átlátszó and Átlátszó Erdély, involved the Serbian Centre for Investigative Journalism in Serbia (CINS), the Slovak Investigatívne centrum Jána Kuciaka (ICJK) and the Croatian/Slovene Oštro. Within the framework of the project, the participating newsrooms explored the €826 million of grant money allocated by the Bethlen Gábor Fund to countries beyond the borders, on which ATLO produced an interactive article. This project has been selected by the Global Inverstigative Journalism Network (GIJN) as one of the best data-driven projects of the current week.
We have created an interactive article on the first year of the COVID-19 outbreak in Hungary, entitled “One year of the pandemic” .GIJN has also selected this material as one of the best data-based projects of the current week.
Another important project was the Mosquito Monitor, for the Centre for Ecological Research. The aim of the site was to provide an interactive, visual display of data collected on invasive mosquito species, with regular updates.
In July, we launched our project dedicated to the Hungarian opposition primaries, which, as the name suggests, was designed to follow the events of the two-round primary elections organised by six Hungarian oppositon parties. As part of this, we wrote a number of analytical articles for Atlatszo and created a data visualisation page on ATLO, where visualised data from the first and second rounds could be followed live. The site had nearly 300,000 page views and 170,000 unique visitors, making it the second most visited project site on ATLO this year. According to Datawrapper, the results page was one of the top election pages of the week.
Hungarian opposition primary: Maps and charts about the final results
The Hungarian opposition primaries ended last Saturday and the counting of the votes began on Sunday morning. In order to show the results, data journalism section of Atlatszo, Atlo launched a subpage dedicated to the first and then the second round of the primary election.
At the end of the year, there was a major collaboration, called interactive Alternative Budapest site which we created for Budapest Brand. On the site, we presented the connections between alternative cultural sites in Budapest in a map and network diagram.
ALT.BP – Alternatív Budapest adatvizualizációs oldal
A városi épületek, terek és zugok, az elhagyott raktárak és felújított ipari komplexumok művészettől és kreatív energiáktól pulzáló sejteket, pontokat, halmazokat rejtenek: a budapesti kultúra sűrűn lüktető hálóját alkotják. Ezt a hálót, finom szövetet kíséreljük meg lemodellezni: feltérképezzük az alkotás csomópontjait, illetve megmutatjuk egymáshoz való viszonyukat.
In addition, we also produced a number of other smaller and larger works:
- For the end of the Summer Olympic Games, we produced Hungarians at the Olympics, which summarised and presented the achievements of the past 125 years of Hungarian Olympic participation.
- CoronaMonitor has been redesigned and we have added several new sub-pages, such as Vaccination. The site was again the most visited ATLO site this year, with 2.3 million page views and 1.9 million unique visitors.
- The main page of ATLO has also been redesigned. The bilingual site offers visitors not only our latest or most popular works, but also additional pages with printed and educational material.
- We have also produced two pilot projects this year. One was our Climate Maps: where you can browse maps of Hungary according to specific climate aspects. The other was Half an Hour, in which we mapped the half-hour drive from the centre of a county town using a special method based on Craig Taylor’s Coral Cities. The latter was among the best data visualisations of the current week, according to Datawrapper.
Successive waves of the pandemic
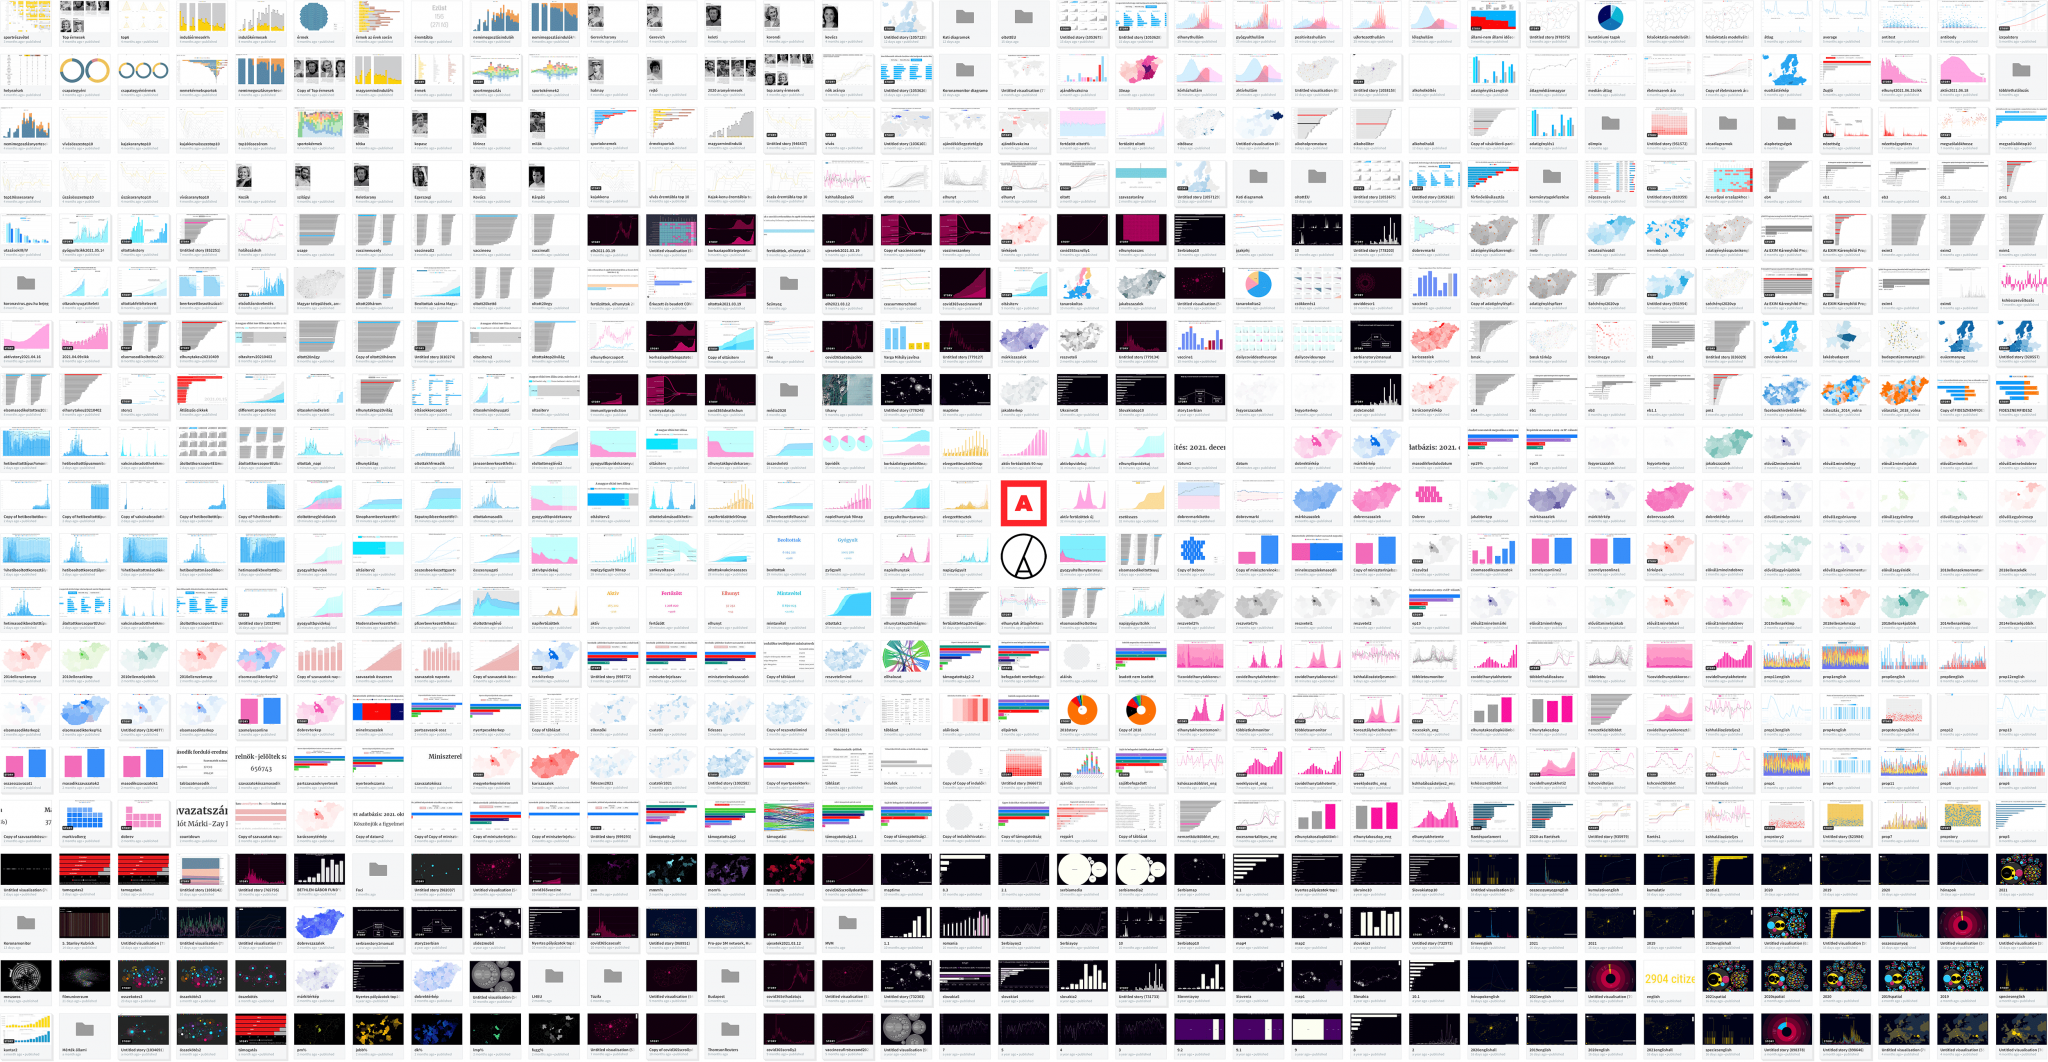
This year’s charts in one image – screenshot collage of Flourish stamp images (click on image for full size)
Last year, we managed to expand our team, with the arrival of András Hont as editor of the data journalism column, and our colleague, Zita Szopkó who started writing data-based articles alongside Krisztián Szabó. Luca Pete, Tamás Molnár, Hédi Szabó and Ádám Gyurcsik have written or assisted in several articles, and we have been able to give them the opportunity to work on different topics in addition to their university studies. Tamás Szémann is also a regular contributor with his data visualisations, for which Boglárka Rédl writes the texts. Krisztián Szabó received the Junior Prima Award in the press category this year.
Translated by Zita Szopkó. The original, more detailed Hungarian version of this article was written by Attila Bátorfy, András Hont, Krisztián Szabó and Zita Szopkó, and can be found here.
Support independent investigative journalism in Hungary, become a patron of Atlatszo on Patreon!
Share:
Your support matters. Your donation helps us to uncover the truth.
- PayPal
- Bank transfer
- Patreon
- Benevity
Support our work with a PayPal donation to the Átlátszónet Foundation! Thank you.
Support our work by bank transfer to the account of the Átlátszónet Foundation. Please add in the comments: “Donation”
Beneficiary: Átlátszónet Alapítvány, bank name and address: Raiffeisen Bank, H-1054 Budapest, Akadémia utca 6.
EUR: IBAN HU36 1201 1265 0142 5189 0040 0002
USD: IBAN HU36 1201 1265 0142 5189 0050 0009
HUF: IBAN HU78 1201 1265 0142 5189 0030 0005
SWIFT: UBRTHUHB
Be a follower on Patreon
Support us on Benevity!