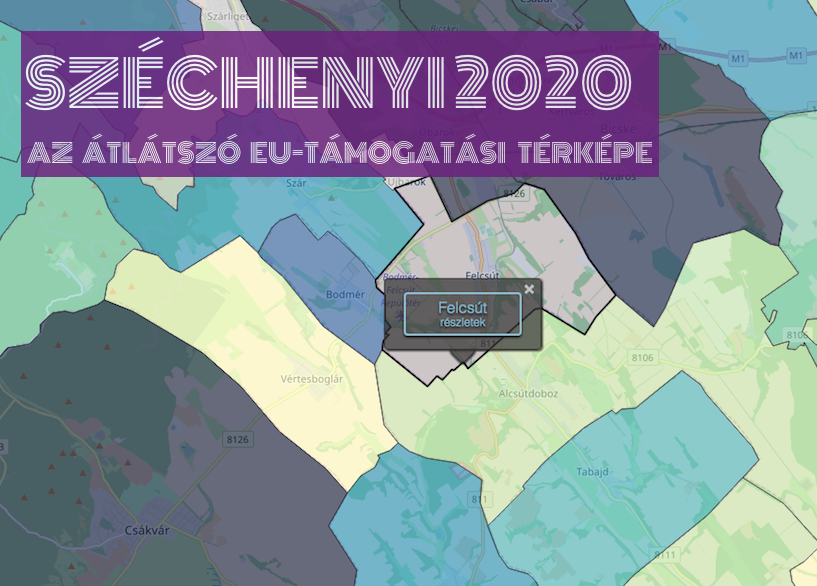
Atlatszo released the second interactive map that shows how the Hungarian government is spending European Union funds. The latest interactive map visualizes projects and payments of the Széchenyi 2020 programme, between 2015 and 2017. Every week, up until the end of the programme, we will update the map with the latest payments. You can now browse through the data, look up your own town or village and see who received EU funds in the area. If you see any irregularities, please let us know and we will look into it!
The previous version of our map shows how EU funds were spent between 2007 and 2015. We published several investigative stories based on tips that our readers sent us after looking at this project. This data visualisation received international recognition: it was, for example, nominated for the European Press Prize in the category of innovation.
The most recent map introduces several new features. It shows you, for example, how much money each township and/or region gets every month. This, among other interesting facts, tells you that the prime minister’s home village, Felcsút, received 26 million HUF every month in the past two years. Neighbouring Bicske, however, got 612 million HUF every month in the same period. This map is also faster and more user-friendly than the previous version and it allows you to download the data. It also visualises some of the data.
There are numerous polls and data proving that when EU funds are spent there are more irregularities than during projects financed by the government or local authorities. The reason for this might be a lack of interest and a lack of information when it comes to spending EU funds. We sincerely hope that this database and map will help those who wish to know more about local EU projects and that they will motivate them to keep local authorities accountable, to go up to them and ask if the projects were implemented.
The source of the data is the government website palyazat.gov.hu.